|
Contraceptive use |
Natural features |
Family planning |
|
|
|
|
|
Service accessibility in Denpasar district (Bali, Indonesia) |
||
Software Development and Recent Technological Innovations for Geographical and Statistical Applications for Population Activities – the United Nations Statistics Division experience
Paper prepared for the
First International Health Geographics Conference - Mapping Health into the Future
Baltimore, Maryland, 16-18 October 1998.
by Vu Duy Man and Patrick Gerland
Resume
This paper focuses on issues related to GIS applications in international health and development. The authors review some of the recent developments in electronic atlases and geographical population databases for health and population activities. Various strategies are considered, and the experience of the United Nations Statistics Division is reviewed in the light of the PopMap software development and dissemination.
The paper offers an in-depth overview of PopMap and MapScan its companion program. After looking at the historical setting, the software development framework, and the software main features, the strengths and limitations of such an approach are examined in the context of the United Nations technical cooperation programme to support population activities in developing countries.
Application of geographic databases for population programmes
Computerised mapping, geographic databases and Geographic Information System (GIS) have given information new meaning and applications. Originally developed for environmental applications and use by specialists, geographic information systems are now increasingly applied to other fields, from facilities management to marketing health service provision and population census analysis. They are also used more and more by non-specialists with little or no training in computer and geography. GIS is becoming a vital tool to help nations understand what resources they have and how best to use them (Wilson 1997).
What is a Geographic Information System or GIS? Basically, it is a computer-assisted information management system of geographically referenced data. It supports spatial decision-making and is capable of linking descriptions of location (spatial data) with the characteristics of the phenomena (attribute data) found there. The spatial data contain information in the form of digital coordinates, usually from maps or from remote sensing. These can be points (for example health clinics, or villages), lines (roads and rivers), or polygons (administrative districts and climate zones). The attribute data contain information about the characteristics of the spatial features, for example health personnel at a clinic, type of road access, or district population.
GIS can address various problems and will answer questions on: locations, what are the attributes at a specific place?, conditions, where are the places that have certain attributes?, trends, how do attributes changes spatially over time?, routing, what is the shortest, or least expensive path between places?, and patterns, what is the spatial distribution of attributes and possibly its reason?. GIS is also used to simulate "what if" scenarios.
The United Nations report "Geographical Information System for Population Statistics" (Series F. No. 68, New York, 1997) discussed many useful applications of GIS for population related statistics, such as census preparation/field operation/result dissemination, epidemic studies, reproductive health and family planning service provision and demographic-environmental development studies.
There is an increasing need and interest on use of spatial information for development planning in the countries, especially at the micro level. Many country projects have purchased GIS software and hardware, and requested international experts to install the hardware and software and to initially train the users. The latest revision of the United Nations Principles and Recommendations for the 2000 Population and Housing Census Round (Series M, No. 67, Rev. 1, New York, 1998) include new recommendations about computerised cartography, geographic databases and GIS, thematic atlases and data dissemination.
Geographic databases for managing and monitoring programmes
Users are realising increasingly that geographical information systems are not just some computer software for making maps; they offer strong data management and analytical capabilities.
There has been a growing concern on the quality of reproductive health (RH) and family planning (FP) service delivery in developing countries. Easy physical accessibility to basic health care and referral services for specialised care is an important criterion that has to be monitored to improve the qualitative dimension of the RH/FP programmes. GIS is the best tool for studying physical accessibility, and for identifying and locating on the map the families with reduced or limited access to such services. Partnerships between health and RH/FP professional and information specialists are desirable to study the spatial patterns of the distribution of basic health and family planning services, the proportion of population at different levels of accessibility to these services, and the strategic locations of future service centres. There is an urgent need to have maps showing the precise locations of the basic health care service centres, including the RH/FP service centres (geographically in latitude and longitude) and the distribution and population of villages and urban areas. With affordable modern computer technology, developing countries can now map health facilities.
In fact, geographic databases and desktop mapping have changed the way people look and treat information. These dynamic databases link data to a location, making it possible to graphically manage, analyse and present information. Thinking of information and everyone realise that almost everything relates to a geographical location. Where is it located? Why is it there? How do we get there?
Automating and managing information assets are essential and greater support and return of investment can be obtained from geographic databases. Many day-to-day activities are carried out in particular locations.
Reproductive health services, for example, are available from service delivery points scattered in towns, districts and provinces. Tracking performance and evaluating the quality of services are essential in determining programme effectiveness. Visualising the locations of health facilities, presenting information as maps, and analysing locations can help facilitate planning and better decision making.
|
Contraceptive use |
Natural features |
Family planning |
|
|
|
|
|
Service accessibility in Denpasar district (Bali, Indonesia) |
||
Such integrated data analysis can be very helpful in supporting decisions based on: population coverage, accessibility, costs, service efficiency, service areas, priority zones, sites location/staffing, quality of care, etc.
The figures below show how to identify service areas using census data, road network, and family planning service delivery points for two provinces in Madagascar.
|
|
|
|
Service accessibility in Antanarivo and Fianarantsoa provinces |
|
Managing programmes requires a great deal of human and technological resources. Geographic databases help detect important events (like knowing where adverse trends are happening in order to provide services where these are most needed); determine the causes of deteriorating indicators and the areas where a particular risk is both high and deteriorating; identify communities most in need of resources; what social, political and economic issues influence health outcomes, and so forth.
GIS is a fairly new analytical and planning tool, especially for developing countries. It has a tremendous capacity to make comprehensive and timely analysis of complex database, and the potential to improve data collection, analysis and visualisation processes.
Software trends
Historically most cartographic and graphic visualisation work has been done by hand. This has been changing overtime with the appearance of easier to use, more powerful, better integration and connectivity between desktop mapping, GIS software, spreadsheet, illustration and graphics presentation, and desktop publishing software.
With the PC revolution of the past decade, most of these tasks are being done on microcomputers using increasingly standardised software programs. This greater access to computing power, combined with more user-friendly software program interfaces, made it possible for most non-computer specialists to work directly with maps and data without relying on computer programmers or cartographers.
Word processors and spreadsheets have become daily commodities for data analysis, presentations, reports and publications. Ever more powerful and easier to use spreadsheets have allowed anyone to create their worksheets, apply formulas, create graphs and even thematic maps (Quick and Schweikart 1996). The need for standalone dedicated programs has decreased to a few number crunching tasks involving either large datasets, fairly complex models or solving specific problem.
With the very fast pace of technology in the last couple of years (CPU speed has been doubling every 18 months; commercial hardware and software manufacturers releasing new products/versions every year), one would believe that in-house software development and custom-programs have no place anymore. Despite the technological challenges involved in developing Windows software or Internet/Intranet applications, a complete new generation of programming languages (Java, Visual Basic, Delphi, etc.), development tools and libraries keep appearing to create new programs and customised applications. The flow of new commercial, shareware and freeware utilities, off-the-self software packages, and on-line web-aware applications demonstrate the dynamics at work.
The latest spreadsheet and database generations offer, in addition to the early templates and macro commands, some full-fledge well structured programming languages (e.g. Visual Basic for Application) as well as the capability to work with third party components using OLE (VBX, OCX) or other form of data exchange and dialogs (ActiveX, Java). Multiple commercial mapping and GIS software vendors offer standalone products, and development libraries enabling end-users or programmers to add or embed some mapping or GIS functionalities to their own databases or software applications – blurring the line between GIS and traditional information systems.
In addition, the widespread use of the Internet offers an increasing level of cooperative distributed computing, allowing an ever greater number of users and applications to share, access and use resources dispersed in multiple locations. It is only a matter of time (in fact it is a reality for users in countries with good Internet connectivity), that anyone using a spreadsheet with some data could rely on the latest data, map or analytical model developed somewhere else in the world.
Searching and accessing almost any kind of information as well as communicating and sharing knowledge are two of the major advances provided by the Internet to almost anyone, anywhere, anytime. The latest statement for the time being is over optimistic: speed, quality and cost to access the Internet depends on several conditions: computer, modem and phone line or local network and dedicated-line, Internet account, service provider, country connectivity and regulations.
To this extent the availability of software, maps and data on CD-ROM is a good complement to the Internet, and can empower remote end-users with a comprehensive collection of useful tools and basic datasets for a variety of applications.
The challenges
Several issues emerge when designing a widely usable geographical information system. Briefly, who are the users, what are the benefits expected of the system compare to the actual set-up, how much time will it take to set it up, what skills are available locally; how sustainable is the activity in term of training, database development and maintenance; what is the institutional commitment; what co-ordination and exchange is possible with other data producers and users; what is the cost of the hardware, software, staff, time, and space.
Geographic information systems organises and uses geographically referenced data and non-spatial data to develop maps and graphics presentations on data, providing support to planning and decision-making activities. GIS is a very powerful and useful tool, but its development and application require considerable planning and skilled use of resources.
The implementation requires coordination of prospective suppliers of data and users of the GIS throughout the organisation or across different organisations. The organisational location of a GIS therefore is important in ensuring its success, and determines the time and cost of development.
GIS systems provide services to other organisations and various data producers and data users. The interdependencies of national, state and local government programs demand cooperation in collecting, processing and disseminating information. The principal collectors and/or producers of information from various government agencies at different subnational levels cover sectors such as health, education, welfare, labour markets, environment, etc. Collected information is indexed, processed and organised for use by those who manage the distribution of the country’s resources.
In setting up a statistical GIS, attention must be given on hardware and software compatibility, standardisation of data formats, spatial referencing conventions, and in the selection and definitions of spatial data themes and indicators. Practical steps include, for example, such basic requirements as standard classifications, common geographic codes and administrative structure as well as common file formats for data and maps (Deichmann 1996).
To understand and appreciate the full impact and potentials of GIS require having the proper tools (hardware and software), GIS-trained people, and development of specific applications for everyday decision-making. A properly developed GIS enables easy development of specific applications for supporting everyday decision-making, with computer produced maps showing on a single page (or screen) what will take pages to describe in words and numbers.
Unlike many western countries, there is little or no commercial market for maps and data in most developing countries. The public sector is the main producer and primary user of such information. Data and maps in many countries are not always available, or are not in digital formats that are suitable for GIS applications. There is massive work to convert data and to digitise maps. In most countries building core databases requires tracing, scanning and converting raster-to-vector maps (Stevenson 1995, Suharto and Vu 1997).
In addition, many existing paper maps are often outdated or incomplete. The quality of the information often needs to be crosschecked. Most countries are facing rapid changes; urbanisation, migration and population growth impose frequent revisions to the existing administrative structure. Sub-divisions change, merge or split, and new ones are created. As a result, datasets and maps need to be revised regularly to take these changes into account.
In general censuses and administrative registration systems provide the basic framework to collect some key information. Surveys can be used to collect more in-depth information on particular issues.
One of the goal in many countries at the national, regional and local levels as been to build a spatial data infrastructure, to create and maintain platform- and format-independent maps and datasets that is cheap, easy to use, and sustainable (Wilson 1997).
In many developing countries, the situation varies a lot between organisations in natural resources, environmental agencies, infrastructure and utility companies and the socio-economic and health sectors.
Despite the fast growing applications of these techniques, many institutions and individuals of population and related sectors still have difficulties in deploying them. The issues could be among others: lack of awareness, lack of skilled people (to compile data and use software), or lack of resources.
In numerous instances where some of the best known commercial software packages have been provided to some institutions, the national staff involved in using these software programs were not able to operate them successfully, even after some training. In several cases, foreign experts were able to use these software, but the nationals were unable to continue or maintain the work on their own. It is common for government employees who are skilled with the software to be offered other better paying jobs.
Developing countries are realising the proven benefits and impact of GIS applications. In order for the GIS activity to succeed and survive, it needs the right combination of people, hardware/software, and data (substantive information and maps) supported by a financial commitment to sustain the initiative. Too often such GIS activity is an ad-hoc project. Once the external funding stops, everything stops.
A key point - and it has always been one of the difficult challenges of technical assistance - is in sustaining such a GIS initiative and in transferring knowledge and expertise among national staff.
Some strategies
GIS and Desktop Mapping
GIS is often referred to high-end systems used by GIS professional with emphasis on spatial analysis capabilities. However, the distinction between GIS and desktop mapping – software packages that provide most of the functions needed by an average user – is not always clear. There are hundreds of commercial software on the market ranging from professional GIS, desktop mapping, thematic mapping integrated in spreadsheet and statistical packages, to simple map browsers and multimedia viewers.
The application of GIS can be expensive. It involves many cost components such as system design, hardware and software acquisition, training, data capture and conversion, and system maintenance. Therefore, decision to implement a GIS project has to be planned carefully. This is the reason why in both the conclusions and recommendations of the Expert Group Meeting on Innovative Techniques for Population Censuses and Large-Scale Demographic Surveys (NIDI/UNFPA, The Hague, 22-26 April 1996) and the revised (1998) United Nations Principles and Recommendations for Population and Housing Censuses, formulations on the use of GIS are rather cautious. Specific GIS technology should only be considered at a level appropriate to the skills and resources available. Complex and expensive GIS solutions are not worth pursuing where simple and inexpensive mapping solutions can satisfy the needs (Pinals 1998, Culpepper 1998).
GIS is a fairly new analytical and planning tool, especially for developing countries, but has tremendous capacity to make comprehensive and timely analysis of complex databases and potential to improve data collection, analysis and visualisation processes.
For further reading on GIS and applications in population field: Deichmann (1996, 1997), Tripathi (1995) and United Nations (1997).
Multimedia atlases, on-line atlases and map browsers
With the advent of the PC revolution – better computer graphics capabilities, combined with the development of graphic user interface such as Windows and hypermedia navigation and display – some new ways of visualising and using spatial information have appeared such as electronic atlases, cartographic animation and multimedia.
Beside the traditional paper atlases, a complete set of electronic atlases have appeared on floppy or CD-ROM offering some very attractive and innovative ways to display and browse socio-economic indicators, thematic profiles, map layers. The range of products for the mass-market to name a few include Encarta Virtual Globe (Microsoft), PC-Globe and Maps and Facts (Broderbund), 3D Atlas (Creative Wonders), OneWorld Atlas (Virgin), Small Blue Planet Series: The Real Picture World Atlas and 3D Talking Globe (Cambrix Publishing), Global Explorer (Delorme Mapping), etc. In addition most electronic encyclopaedias include some maps, and some basic atlases.
More recently with the spread of the Internet, an increasing number of on-line mapping and atlases have appeared providing similar functionalities, often with less multimedia look-and-feel, but with potentially "real time", or "live" and up-to-date information covering often more professional topics, or specific areas. Numerous private and public services have setup servers delivering various thematic mapping services, address matching, routing or location maps. Several major GIS commercial vendors like ESRI, MapInfo, Intergraph or Autodesk have been offering for the last year(s) several software solutions enabling organisations with vast amount of existing digital information to leverage their investment, and provide organisation wide, and virtually anywhere in the world through the web some access to various thematic views of their databases (Limp 1997, Plewe 1997).
Such profusion of nice looking multimedia-rich atlases – or live maps on-line – can easily give the illusion to many people that almost everything is out there, somewhere on the web or on a CD. Such products have some educational and informational value, and can provide end-users fairly simple ways to access and visualise a large amount of existing data. However, these types of products are often closed systems, designed to empower end-users with browsing capabilities rather than some analytical or advanced computing capabilities. In most cases the information displayed on the screen can only be printed or exported only in some bitmap format good only for presentation or some reports. Vector layers or database attributes can seldom be accessed, used or exported. In addition, most of the time user’s local data cannot be integrated or easily added to such systems.
National and local electronic atlases
In the context of health and planning authorities in many developing countries, the usefulness of such existing products and approaches (focusing primarily on international or developed countries) are limited. Kraak M.J. and F.J. Ormeling (1996) distinguish several types of electronic atlases: view-only, interactive and analytical. The view-only atlases are typically outputs organised and presented in a linear or structured way. The end-users can only browse and look at existing views. Examples of these view-only atlases include many multimedia atlases, and web pages with some static image maps. Interactive electronic atlases are intended for a more computer-literate audience, but they allow users to manipulate the data sets. In this case, the maps and views are dynamically generated based on user’s interaction. Finally, analytical electronic atlases take advantage of the full potential provided by the electronic environment. Beside queries and data manipulations, users can compute, combine and use its own maps and data. This last category of electronic atlas offers the most potentials for many professional applications.
Several organisations have produced some electronic atlases, sometimes in cooperation with a commercial company. By having associated graphing and mapping capabilities, existing databases can greatly increase their usefulness. Beside being able to access existing pre-made templates and outputs, users can extract and export data, generate their graphs and/or maps, print or paste them into a report or other applications, etc.
Many users want data for relatively small areas concerning various socio-economic matters. While the database may be for one data source, some historical or multi-sectoral information can be included to allow users to observe prevailing trends or patterns over time and space.
An electronic atlas in the context of socio-economic data at the national and sub-national levels is a digital collection of maps with illustrations, information tables and texts. It can combine statistical indicators, tables, texts, maps, graphs, pictures, video, audio and animation into a powerful, effective, and entertaining presentation, enabling better data visualisation and dissemination.
|
|
Maps
|
Graphs
|
Creating and distributing data in the form of electronic atlases has become an easy, quick and inexpensive undertaking.
Some of the distinctive highlights offered by electronic atlases – in particular the interactive and analytical ones, are:
Some reasons to make electronic atlases
Electronic atlases are not made to replace printed materials, but rather to complement them and empower end-users, and decision-makers with some more interactive and analytical abilities to pinpoint specific problems, identify particular situations, test what-if scenarios, and so on (Water and De Leeuw 1987, Kraak and Ormeling 1996). Some of the major motivations to create such electronic atlases are the following:
The information required
The quantity and detail of information required to build a database varies a lot depending of the scale and scope envisioned. Simple atlases with a couple of maps, and a few indicators can be developed today in matter of few hours or days. More substantial databases require obviously more time and efforts to assemble, but can deliver a richer set of maps and data to end-users.
The major maps and datasets required to build a thematic electronic atlas are:
|
|
National and sub-national maps with administrative boundaries by regions, provinces, districts and counties as well as routes, rivers, and other geographical features or information layers. Maps can be imported, drawn or traced using either a mouse, a scanner or a digitizer. |
|
|
Census and administrative data, health statistics and indicators, tables and textual profiles for individual administrative units included in the maps. Data can be keyed-in, cut and pasted or imported from different database or spreadsheet file formats. |
|
|
Statistics and information about major towns, villages and human settlements or community-based facilities at particular geographical locations. |
Database creation and existing digital databases
As seen earlier, several companies have developed mapping software programs and ready-to-use data sets of census blocks, zip codes, or market areas. While this has led to the development of a suite of software packages appropriate for industrialised countries, the lack of standardised databases for other countries remains a major obstacle for applications in developing countries.
An important new set of digital products of particular interest for developing countries has become available in the last couple of years. They are providing maps and data layers in some formats more accessible, and manipulable with various software applications, allowing to use some of their contents as a starting point in building some digital database, or adding some extra layers of information.
Products in this category include various digital datasets from the US Defense Mapping Agency (DMA) such as The Digital Chart of World (CD-ROM versions from various GIS software vendors, and on-line server from PennState University), and several global and regional maps and datasets assembled by various commercial and non-commercial organisations: Global Demography Project (NCGIA), ArcWorld Supplement and ArcAtlas (ESRI), Africa Data Sampler (WRI), African Population Database (NCGIA, UNEP/GRID, WRI),
Asian Population Database and soon the Latin American Population Database (NCGIA, UNEP/GRID, CGIAR). In addition, specific country data holdings are available from organisations such as: USGS, CIESIN, United Nations Statistics Division and WHO/UNICEF that provide some useful basic administrative reference map coverages, and some additional layers, including in some cases tabular data/statistics.In addition various digital gazetteers, and village databases can provide point level information about locations and eventually health and socio-economic information at the community-level, or household levels (e.g.: WHO/UNICEF Healthmap programme).
However, despite this increasing availability of basic maps and datasets, many organisations at the local or national level need to modify, update, or create their own databases.
Application developers and end-users
What many local and regional organisations need are not only browsing facilities, but also some tools enabling them to build and to maintain their own digital information systems. Browsing and dissemination of the existing databases are an important dimension of any effort, but should not be overlooked if the statistical and spatial information that makes up the substantive part of the system are deficient, obsolete or unsustainable.
Commercial relational database systems and state-of-the-art GIS on true client-server architecture offer optimum solutions for most advanced countries. However, high-tech options are often unrealistic for many less-developed countries or those with limited resources.
The key issue is database sustainability; limited capabilities and frequent staff turnover combined with scant resources make it difficult, if not impossible, to rely heavily on training and support for high-tech applications. It is more beneficial to choose a simple and robust design that many more users can easily understand and maintain, and that can be transferred to software packages independent of any hardware platform.
One strategy followed by the Computer Software and Support for Population Activities project of the United Nations Statistics Division has been to promote an open software policy and favours low-end software packages that can be provided free-of-charge to end-users. The packages must be easy to use, run in the most commonly available PCs in the field and yet allow end-users to build geographical databases without external assistance.
The constituency to be addressed is involved in various United Nations population-related programmes, government agencies, universities, research and national training institutions in developing countries. This includes statisticians, demographers, analysts, technicians, trainers, researchers, planners and decision-makers with little or no prior computer background or experience in database, cartography or mapping involved with basic data collection, data analysis, population and development planning, health, education, information or communication activities.
In the early 90’s when the project identified these needs, computer hardware and existing commercial software applications did not provide any good solution to this issue (Kendall 1991, Gaughan and Allen 1992, Smith and Eglowstein 1993). To build and use such information system, a combination of DBMS, spreadsheet, CAD and mapping software was used, making it more expensive, often difficult to learn and apply. Today most commercial solutions provide good end-user browsing solutions, but have limited map and database creation capabilities (Marshall 1995). Beside the high cost, mastering various software components, and having a good knowledge of relational database concepts are necessary to make a robust GIS (Korte 1994 and Jones 1997). These requirements can greatly limit the use of geographical databases among non-computer specialists. It is in this context that the project decided to develop PopMap and MapScan.
The PopMap experience
Background
PopMap software development is unique and a model of North-South and South-South collaboration: it is a rare example of a full-fledged software package developed by a national institution in a developing country (Viet Nam) for use in other developing countries.
PopMap for Windows (United Nations 1998b) has been developed by the United Nations Statistics Division with special funding from the United Nations Population Fund (UNFPA) through the interregional project INT/96/P74 "Computer Software and Support for Population Activities" in collaboration with the Viet Nam Institute of Information Technology. The experience and valuable feedback of many users, technical advisors and national experts from many developing countries were incorporated at the various stages during the development, and had greatly contributed to fine-tune the program to local needs. Nationals from Algeria, Bangladesh, Brazil, China, Ghana, Honduras, Iran, Sudan, Uganda and Viet Nam acted as trainers at regional and sub-regional training workshops, and contributed in producing the French, Spanish and Portuguese versions of the software.
PopMap was designed at the end of 1989 and the development of the DOS version started the following year. By 1991 distribution of PopMap version 1.0 began. Since then several enhanced versions have been released (United Nations 1994). In 1994 the project migrated PopMap into the Windows platform to increase performance, integrity and connectivity of the software.
After more than three years in the making and more than a year of testing and quality control, along with the valuable support and feedback of many users over time, PopMap for Windows has reached a mature stage. PopMap for Windows is programmed in C language (450,000 lines of code) and uses several state-of-the-art libraries to provide a full set of industrial strength functions and commands empowering end-users with a robust integrated environment and a set of tools to easily create and maintain their geographical and statistical databases.
A real application bottleneck of computerised mapping technology can occur with map digitising. To help overcome the problem, the project developed MapScan as a tool for automatic map data entry (United Nations 1996b). MapScan uses scanning, optical character recognition and raster-to-vector conversion technologies. A DOS version was released in 1996, and the Windows version will be released this year as a companion product of PopMap for Windows (see page
* for further details, and United Nations 1998c).The rationale for the development of PopMap was – and still is – to give developing countries an easy to use tool for producing geographical databases for country, district, and community applications. At the time PopMap was developed in late 1989, only a few mapping software programs existed for the PC platform in the commercial market (Day 1986, Noronha 1987). PC-Globe provided mapping facilities on a world map with pre-made indicators for most countries of the world. Atlas Graphics (Strategic Mapping) was the only one that offered limited digitising capability with an optional module, MapEdit, for users to create their own boundary files. Most mapping software did not follow any database concept. Rather they worked with files that made it inconvenient to use when developing a geographical and statistical information system.
Since its inception PopMap was designed not simply as mapping software, but an integrated and structured database of statistics and maps. Users work with the names of areas, indicators, facilities, and facility attributes, and not with files. Typical population databases have time series; PopMap incorporated time reference as one of its data dimensions.
Data for different statistical units (districts, provinces, schools, clinics, etc.) can be integrated, stored, queried, retrieved and analysed. Instead to work with individual datasets, the possibility to combine and work simultaneously with several of them have multiplied the possibilities to uncover patterns, answer questions, and solve problems.
Software profile
PopMap is an interactive information and decision support system for population activities. Combining database and spreadsheet facilities with mapping and graphic presentation capabilities, PopMap is a versatile tool for organising data required for development planning and showing existing, historical, or projected conditions or hypothetical results in meaningful, easily understood forms.
In developing PopMap, emphasis is given to facilitate quick application development and maintenance as well as analysis and presentation of the national and subnational information. Best of all, the software hides the complexity of creating and maintaining a database of statistical indicators and community-based facilities data as well as drawing, or importing and updating its own maps.
The emphasis on statistical database development for sub-national applications and programme support has enabled PopMap to provide the basic elements for developing a simple, yet sustainable geographical information system for thematic and interpretative analysis and presentation
Skill, time, resource and hardware requirements are minimal. The system offers an easy-to-use graphical user interface. It is designed for analysts, researchers, planners and decision-makers with little or no prior computer background or experience in database, computer graphics, programming, cartography and map creation. Its functionalities, ease of use, free access, comprehensive manual and availability in English, French and Spanish enable new users to develop applications without any technical support.
PopMap
combines many components into one package: tools for creating, editing and maintaining a geographical database with multidisciplinary statistics, map features and community-based facilities; capabilities for retrieving and processing data in a worksheet environment and for creating statistical graphs; options for analysing, interpreting, and developing effective data presentations using maps.Typical applications of PopMap for population activities include among others:
Brief overview
PopMap for Windows offers an integrated geographical database for statistical data with desktop mapping/GIS software facilities. Obviously task-oriented application software, like PopMap, is more limited than commercial software. However, it has the advantage to offer some special support for specific tasks combined with some user-interface enhancements to facilitate its use as well as geographical database development, maintenance, and distribution.
The main focus of the software is on statistical database development for sub-national applications and programme support. The underlying design provides a database application framework for data and meta-information (topics, definition, source, footnote, comments, and attachment). The software includes tools to develop base maps and to create and maintain a geographic database.
The process of developing applications with PopMap is quite easy. There are three main modules. The first is for establishing a statistical database where the administrative structure is defined, including indicators and facilities occupying the geographic areas. Data is entered manually or imported from other sources. The second is for developing maps and for geo-referencing the administrative boundaries. There are several alternatives to draw maps and, in the absence of digitizers and scanners, the mouse can be used. The third module is for retrieving and presenting the information either through thematic maps, graphs or worksheet data. PopMap has a built-in spreadsheet that performs simple but useful functions.
The three PopMap modules are: Data Retrieval System for the databases users, Data Editor and Map Editor for the databases developers.
Data retrieval, browsing and mapping
The PopMap Data Retrieval System is easy to use. It offers the user a sequence of steps to get the base map, to get the data, to look at the data as a table, or as a graph, and to create dynamically thematic maps. At first glance, PopMap may give the impression of being another "PC-Globe". This is part of its intended purpose: the end-user should not need any specific training or support to use a PopMap application database. The brief end-user guide should be enough to operate an existing application. The PopMap Data Retrieval System is designed to offer a simple, efficient way to access, analyse, and display data geographically. The built-in spreadsheet provides users with an embedded environment to process data; compute secondary variables; graph data; import, export, sort data. What’s more, the user can do all that without leaving PopMap. Also, computed and imported data can be used immediately for mapping.
|
|
|
|
PopMap Data Retrieval System user interface: area selection, map views, worksheets and graphs |
|
The Data Retrieval System module is the main component dealt with by the ordinary user of the geographical database to perform the following functions:
|
|
|
|
Access multimedia information for selected item (Ghana) |
Zoom-in with features selection, data browsing and statistics |
|
|
|
|
|
Thematic mapping: colour range, graduated symbol, dot-density, pie/bar charts
Users data and PopMap development tools
The required inputs for applying PopMap are maps (spatial data) and indicators (attributes data). The most important maps are those showing boundaries of administrative units at different levels, since PopMap mainly handles population and socio-economic data that are collected and aggregated for these reporting units. Other features such as roads and rivers may improve logistics study and data display. The degree of map accuracy may vary. Maps of larger scale and higher accuracy will require higher degree of processing. For simple thematic mapping applications, small scale maps and sometime sketch maps are sufficient to present spatial relationship between features.
The core of the attribute databases should have time-dimensioned statistical indicators for administrative units. These indicators are usually compiled from censuses, surveys or administrative records. If the application is focusing on logistics and/or service provision, point data on service facilities such as clinics, pharmacies, schools, nurseries, market places as well as human settlements such as towns and villages are important. These data include locations and attributes of the point features.
|
|
|
|
Multiple user-defined layers are supported |
Thematic mapping and layers overlay |
The availability and accessibility of data is an issue by its own. While lot of data are available and accessible for some countries, one can hardly find appropriate data for others (Melgosa 1998). It is important to know about data sources and to re-use the maximum of existing data, in paper and in electronic format (for a review on socio-economic data and GIS, see Gerland 1996 and Deichmann 1996b).
The application development steps are straightforward. A user starts with Data Editor by declaring the geographical and statistical database structure that includes administrative levels, administrative units, topics, indicators, time references, other layers and facilities with their respective attributes. Layers, features and attributes can be defined with a provision to store meta-information such as topics, sources, footnotes, etc. The data can be entered manually or imported from external database and spreadsheet files (dBASE DBF, Paradox DB, Excel XLS, Lotus 1-2-3 WKS/WK1, Quattro Pro WQ1, etc.) and updated into the database. Data can be aggregated to higher administrative levels. Multimedia information such as texts, graphics and photos, sound and video clips can also be used as attributes of map features. Point data — such as service delivery points and human settlements — can easily be included from Global Positioning System (GPS) readings to map service availability and accessibility.
|
|
|
|
Declaring variables with Data Editor |
Drawing boundaries and assigning area names |
The next step is to use Map Editor to draw the maps with administrative boundaries and "references" them using administrative unit names that are defined in the database.
PopMap stores and manipulates maps in vector format, enabling fairly high-resolution display and printing. Paper maps can be digitised, or drawn and edited using the mouse, by loading a scanned map (or a reproduction on a transparency) on the screen and tracing the boundaries with the mouse (heads-up digitising). More than 30 graphic file formats are supported, including PCX, JPG, GIF, TIF. This technique is cost-effective, easy to implement, and successfully applied at training workshops, and in developing large-scale and complex applications. Both mouse and digitizer support large-scale maps with multiple screen/digitizer size pages, and multiple maps with different scales. Boundaries are digitised in a "spaghetti" mode as line segments. Common boundaries are digitised only once. Area references and point data features, such as villages and health centres, can be located just by drag and drop. Polygon topology is built by the system and is transparent to the user.
Paper maps can also be scanned and passed to an automatic vectorisation process with specialised software to save time and effort as discussed latter in this paper. If map coordinates exist in electronic format, they can most probably be re-used. PopMap can imports and exports map in AutoCAD format (DXF) and other popular mapping formats such as Atlas BNA, MapInfo MIF and ArcView Shape file.
Depending of the number of geographical/ administrative units included in the database, the number of time-referenced statistics, and the number and descriptive complexity of facilities, the time duration for the development of a PopMap application may vary from a few hours to several weeks or months.
Applications
One of the important advantages of PopMap is facilitating easy access to basic space/time information in the form of electronic atlases. PopMap is a useful tool for data dissemination, and can be potentially integrated within a decentralisation policy, or for district planning.
PopMap applications that have been developed cover a wide array of organisations and topics. International agencies built customised global databases with time-series of socio-economic and demographic indicators. Government offices and local planning institutions use PopMap to store and disseminate statistical data, display thematic information or manage community services, local resources and infrastructure locations from national to city level and below.
PopMap is easy to use, many users have developed PopMap databases by reading software manual. Relative good PopMap databases have been produced during the one or two-week workshops that were conducted in various regions for national participants from statistics, population and health institutions.
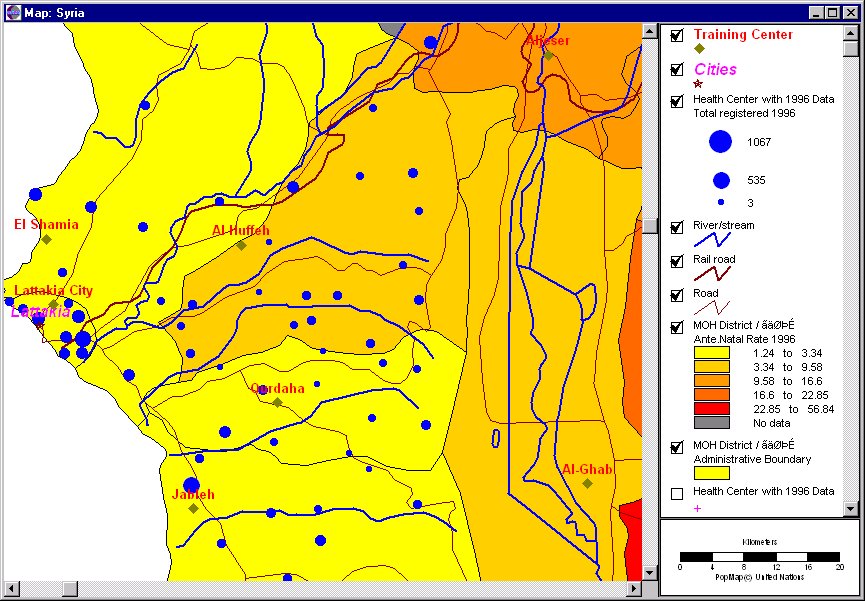
PopMap customised applications, such as geographical databases to support MIS for family planning, electronic census atlases and population geographic databases are found in countries such as Algeria, Bolivia, Chad, Dominican Republic, Honduras, Indonesia, Iran, Madagascar, Panama, Pakistan, Senegal, Sudan, Syria and Uganda.
Statistics offices of Uganda and Madagascar have used PopMap to build electronic atlas for visualising and disseminating data of their latest censuses. Indonesia (BKKBN) and Malaysia (FP association) use PopMap to build geographic database supporting the monitoring of family planning programme, services and activities at district level. Dominican Republic Ministry of Health has used PopMap to create a Health Atlas. PopMap has been used for courses at the UN Statistical Institute for Asia and the Pacific, and Njala University College of Sierra Leone. Just to name a few (see also United Nations 1996a and 1998d).
Many workshop participants have helped the development of important applications such as the Uganda 1991 Census Atlas, the Madagascar 1993 Census Atlas, and the Health Atlas of the Dominican Republic. National experts from Algeria, China, Ghana, Honduras, Iran, Sudan, Uganda, and Viet Nam have helped as resource persons at regional and sub-regional workshops. Nationals made PopMap software and manuals available in Spanish and in French from Honduras and Algeria respectively.
In order to facilitate the initial application development work, users of PopMap can download or receive by mail a sample copy of their own country data to facilitate the initial development work. Over 130 sample country applications with base maps and data are now available. Each application includes (taken from the most recent census date available) the basic administrative structure for two, three or more administrative levels with some population-related variables, and a detailed administrative, geo-referenced base map using Latitude/Longitude. PopMap software users are invited to take advantage of these ready-made applications, expand them with their own data, and update the existing maps.
Many of these data sets were compiled overtime by the project, some were contributed to the various NCGIA and UNEP/GRID population databases (Global Database, Africa, Asia, and Latin America – see page
*) and converted back from Arc/Info format into PopMap.The digitising of boundaries is one of the hardest parts of most GIS application development process. Many users wish to have pre-compiled basic country datasets for their initial use. To response to these requests, efforts were and continue to be made to compile and make available a repository of country datasets. Each dataset will have administrative boundaries of sub-national levels, basic population indicators for the administrative units and possibly other layers such as roads, rivers and human settlements.
For further reading on PopMap software and applications: Castillo and others (1995), United Nations (1994, 1996a, 1998bc) and Vu (1996).
The data conversion issue
Vector data are required for most computer mapping applications, but current tools for converting hardcopy maps to vector format are deficient and still require an enormous volume of work. As a result, huge resources have been spent on data conversion using highly labour-intensive techniques.
Today's tools for obtaining vector data through conversion are manual digitising, or scanning followed by heads-up digitising, line following, or automated vectorisation. Manual digitising, which has been the norm for more than 20 years, and is still being used more than any other method today, is fastidious work and in general requires more time than the other techniques (see Stevenson, 1995).
Since the release of PopMap, interested users had already raised the issue of using scanner to produce digitised maps with PopMap. This request was continuously raised during training workshops, presentations and demonstrations of PopMap. The reason for this request is that the drawing or digitising maps is a painstaking, time-consuming task, and users like to have a tool that will facilitate the work.
Developing the technique to use scanned maps (raster images) and to convert these into vector format is an enormous challenge (Peuquet 1981, Stevenson 1995, Jones 1997, Wilson 1998). The few commercial software packages available today, which are able to do this task, are costly and often difficult to use (Gutierrez 1992, Graham 1997). The Computer Software and Support for Population Activities project of the United Nations Statistics Division had thought of this technique since the inception of PopMap, but realised the considerable time, efforts and resources required. PopMap also was a major priority.
Encouraged by the technical challenge and potential benefits, the Artificial Intelligence Department of the Viet Nam Institute of Information Technology (IOIT), with technical contributions from the project, worked on the raster to vector image technology. As a result, the first version of MapScan – a software package for automatic map data entry – was developed in 1994 (United Nations 1996b).
MapScan is a stand-alone product, and an excellent companion of PopMap, and most other GIS/mapping software. MapScan for Windows – the latest release for the Windows platform - accepts various formats of scanned maps or drawings, reads and converts them into vector maps in formats that can be used by popular GIS/mapping systems (United Nations 1998c).
The scanning process is done outside or inside MapScan (built-in scanning support for any scanner compliant with the TWAIN standard). It is important to produce a good scanned raster image. To ease and improve the conversion, some preparations may be required, such as editing the source material to correct cartographic errors; re-sizing the material using a photocopier to fit the scanner size; tracing the required lines on a tracing paper overlay and scanning the overlay. Large map however can be scanned into pages and MapScan can mosaic either scanned raster or vector map pages to reproduce the seamless large map.
MapScan combines many components into one package: tools for editing and cleaning raster and vector maps; powerful and efficient image processing filters and colour classification to separate layers on colour or grey-scale maps; an advanced OCR engine for assisted mode, or automatic extracting text labels from the raster maps, and for preserving their relative coordinates; state-of-the-art line vectorisation engine enabling interactive line tracing, and automatic map vectorisation with built-in topological reconstruction. In addition, facilities are provided to geo-reference vector maps, and specify map projections, with comprehensive import and export capabilities for industry standard raster and vector maps file formats.
MapScan functions for optical character recognition, image classification, line thinning, interactive and automatic line vectorisation and topology reconstruction use state-of-the-art applied research from the latest developments in computer science, artificial intelligence, computer vision, pattern recognition and image processing.
Software processes
MapScan vectorises maps as follows:
Scanning paper maps and saving them as a raster image. MapScan supports black and white, grey-scale and colour of most graphic file formats (bitmaps), including: PC Paintbrush (PCX), Aldus Tagged Image File Format (TIF), CompuServe (GIF), JPEG/JFIF (JPG), Adobe PhotoShop (PSD), Kodak Photo CD (PCD), MacPaint (MAC), Windows Metafile (WMF), Microsoft Windows BMP and DIB (uncompressed and RLE compressed), Encapsulated Postscript (EPS raster image only), GEM Raster (IMG), WordPerfect (WPG raster image only).
Pre-processing or raster image editing. This process is to improve the quality of the scanned images like eliminating unnecessary items, draw additional items or correct broken lines, rotating an image, and merging multiple pages into one map image. In addition, several image-processing functions can be applied to improve the quality and to obtain better vectorising results. For example, image erosion can be applied to greyscale and monochrome image respectively to remove image noise.
For a colour image, a colour classification (supervised and un-unsupervised) can be used to clean the colour image before vectorising it. Other image processing functions can be used to crop a section, set up a region of interest to vectorise and to resample. Smoothing can be used to eliminate speckles for line work and remove noises, hole filling and image dilation can be used to close gaps and produce continuous line work from broken boundary lines, or empty polygons.
Text label extraction or Optical Character Recognition (OCR) to locate text identifiers for the regions, areas, cities and towns; identify the reference text and determine the spatial coordinates. The user marks the text labels. Recognised texts are removed from the raster image during the vectorisation process, and a text reference file is generated for use in specific mapping and GIS software. This process is optional. If not applied, text labels will be vectorised together with other map features.
|
|
|
|
Mark text labels for the recognition |
Recognising a text label with the option to edit and confirm the result |
Vectorisation.
The raster-to-vector conversion is done in automatic or interactive tracing mode. It involves three operations: line thinning (reduces the width of the line work to one pixel); line extraction (converts the series of pixels into lines and generates the coordinates of the individual line segments); and topology reconstruction (determines the adjacency relationships among line segments and creates line features). Options are available to control the type of features vectorisation (centerline or outline), the quality and the level of line generalisation required. At this stage a vector map file is generated for use in specific mapping and GIS software.|
|
|
|
Boundary line vectorisation |
Vector map editing |
Post-process or Vector map editing. During vectorisation, the raster image can produce unwanted features. The generated vector map can be cleaned by closing polygons, removing dirt or noises as tiny dots and loose small line segments, joining line segments, rotating the map, merging multiple pages into one vector map, selecting line segments and assigning specific layer attributes. Vector maps can also be geo-referenced into real-world coordinates system (Latitude/Longitude), and import/export options allows to work with most popular CAD/GIS vector file formats.
As outputs, MapScan produces a vector map file and a label file (if the text label recognition process was applied) in most industry standard formats such as AutoCAD (DXF) an open-ended, widely accepted industry standard format, Atlas GIS (BNA), ArcView Shape file (SHP), MapInfo exchange file (MIF/MID), as well as MapScan and PopMap formats.
Once the entire process is completed, the reference text file and the vector map file can be used with a mapping system.
It is important to note that MapScan creates map files of line segments (or polylines). To use these line drawings in most mapping software, user may need to build a polygon topology.
For further reading: Suharto and Vu (1996), United Nations 1996b and 1998c).
Highlights of the PopMap and MapScan approach
The introduction and free-of-charge distribution of software like PopMap and MapScan help developing countries to know about the technological development of geographic databases, and to apply it in their population programmes. PopMap — focusing on databases organised along the hierarchical administrative structure — provides a good framework and template for application development in the socio-economic sectors.
PopMap gives ordinary data producers and users the confidence and capability of developing applications. The complexity of creating and maintaining the geographic database has been simplified by providing constant dialog as the process of computerising database and maps evolves. The result is a friendly, easy to use and maintain geographic database that can be distributed or migrated to other commercial mapping and GIS software.
Interactive and analytical electronic atlases have become one of the important applications of PopMap. It is an excellent tool for disseminating data and since the software is distributed free of charge to developing countries, PopMap can easily be integrated within a decentralisation policy.
Some of the key benefits are:
PopMap and MapScan are reliable products with good documentations, support and training materials. They can be obtained on-line, or by mail. They can be freely reproduced, and distributed. These products serve well target users aligned with UNFPA priorities and objectives. The software are in a unique market that has not attracted commercial GIS vendors, and fit neatly into a market niche between mainstream GIS and simple mapping utilities available with Lotus and Excel. The products have the potential to save resources for UNFPA and other UN agencies involved in supporting mapping and GIS activities by reducing hardware and software cost. Most significantly, MapScan is a cost effective alternative of digitizers for spatial database creation. It can save resources by reducing or outright eliminating the need to purchase digitizers and workstation for map digitising. It can also be used in facilitating the computerisation of census base maps in countries undertaking population and housing censuses. Furthermore, MapScan can make better use of available skills in developing countries.
Many countries now realise the impact and value of visual communication — how maps and graphics are revolutionising the whole information and decision support systems. PopMap is an appropriate entry tool for this. The strong features of the software is its ease of use, self-teaching, high level of comfort from the perspective to "low tech" users; it is highly targeted/suited to the intended user community in the population programmes.
There are no non-commercial alternatives to PopMap or MapScan, and commercial software with some comparable capabilities (including in some cases more analytical, marketing-oriented, logistic or physical planning capabilities exceeding PopMap) easily cost thousands of dollars while still falling short of some of the basic features most often required, including end-users ability to develop and maintain their own geographical and statistical databases. PopMap and MapScan are examples of an approach encouraging developing country institutions, such as the Vietnam Institute of Information Technology, to use and produce software at the forefront of technology.
There are arguments on whether application developers should begin with a software like PopMap and then move to a high-end GIS package or, conversely, from a high-end GIS product move to PopMap. For the latter, several institutions have converted some of their data and digital maps from a GIS application and then used PopMap to present and distribute data at local levels. It is difficult to generalise on the best direction to take since developing countries have different levels of technical and technological advancement. The trends are, however, that in the long term, more and more digital information will be maintained on high-end systems and servers, and the transfer to low-end systems like PopMap will become most useful for remote users, and data dissemination purpose.
PopMap can be used as an application framework to introduce and to promote a set of standards, guidelines and recommendations to build and maintain a basic geographic database that integrates demographic and socio-economic time series at national and sub-national levels. PopMap can be seen as a first step for new users to explore the GIS world, and as an ultimate step for advanced users already familiar with high-end GIS products to share and disseminate data to a wider public.
Some lessons learned
The software development process is comprised of different steps: Analysis (specify user requirements and define software features); Design (plan the technical solution); Coding (write the program); Debugging (correct program errors); Testing, implementation and acceptance (ensure good system performance prior to distribution); Maintenance (ensure good performance and introduce enhancements whenever necessary based on actual user needs and requirements); Documentation (produce software documentation, user manual and tutorials, on-line help), Localisation and multi-lingual translation (interface, menu, commands, dialogs, messages, documentation, on-line help), Distribution (on-line, mail, disk and CD), Technical Support (on-line, email, fax, mail, user's network, newsletter), Training (on-line tutorial, self-teaching materials, workbooks).
In order to ensure that a successful software development strategy be effectively implemented, time and commitment are essential, and the work involved for a full-scale integrated software package is not any more a one-man job, but a real team work requiring the staff responsible for the software architecture and analysis to work closely with the software development teams at the design phase (study and recommend technical solutions, evaluate/select/supply materials/tools, etc.), testing (through various application development, and under various computer platforms) and maintenance (specify required corrections/modifications, enhancements recommendations, new features, etc.) of the software. Software documentation can be shared with the software development teams and outside consultants, the development teams being mainly responsible for the coding and debugging of the software.
Software development and distribution in the 21st century as reached a new stage of excellence, where end-users expect from any software package a full-set of professional functionalities, a uniformed graphic software interface providing the same look-and-feel with their familiar desktop software, and the ability to drag-and-drop, cut-and-paste, import-export, link, connect, etc. almost anything… Custom-software development enables a fairly large independence and flexibility in software design, development and distribution, but the new level of quality standards expected from most software users impose a fairly heavy burden and commitment to anyone (independent developer or organisation) to deliver such product.
The emerging techniques of GIS and computer mapping have many use in population and related fields. Software like PopMap and MapScan represent easy-to-use and inexpensive tools for building integrated population and related databases and for improving the data management and data dissemination activities.
The software are highly targeted to the intended user community of developing countries. They are easy to use, demand little computing knowledge, are easily obtained free-of-charge, and fill an unique niche in the market place which is not strongly targeted by commercial vendors but directly aligned with country population programme objectives. In addition, many of the concepts and skills learned in using such software are relevant for operational commercial GISs. Thus, they can be used as tools for technical capacity building, in addition to applications implementation.
New software development tools, libraries, and programming languages keep appearing, and make it ever more challenging to sustain overtime any independent software development. It is however refreshing to see that through the Internet, an increasing number of software programs, and collaborative partnerships do exist and provide a balance to the commercial, market-driven software applications designed and created primarily for business applications in developed nations.
The strategy followed with PopMap and MapScan is to decentralise activities of software development, training and technical support to regional focal points, and to rely on a network of national institutions and experts. The main goal is to maximise the use of local technical capabilities and expertise in developing countries and to reduce international operation costs and staff.
References and further reading materials
Castillo, D.A., P. Gerland and D.M. Vu (1995). PopMap: Experiences and future plans, a technical paper prepared for the UNFPA-UNDESIPA TSS/CST workshop on data collection, processing, dissemination and utilization, New York. 8 pages. (http://www.un.org/Depts/unsd/softproj/papers/csttsspm.htm)
Culpepper, R.B. (1998). Desktop GIS for Business Geographics. Business Geographics, May 1998. (http://www.gisworld.com/print/bg/1998/0598/598gis.htm)
Day C.O. (1986). Putting your business on the Map, PC Magazine, 30 Sept. 1986, pp. 219-234.
Deichmann, U. (1996a). A Review of Spatial Database Design and Modeling. NCGIA technical report 96-3 prepared for the UNEP/GRID and CGIAR (Consultative Group on International Agricultural Research), Arendal III Workshop on Use of GIS in Agricultural Research Management. Norway. June 17-21, 1996. 58 pages. (ftp://ncgia.ucsb.edu/pub/Publications/tech_reports/96/96-3/)
Deichmann, U. (1996b). Issues in the development of spatially referenced population databases, Technical Notes on Population Statistics and Information Systems, United Nations Statistics Division, December 1996. (http://www.un.org/Depts/unsd/demotss/tcndec96/uwe.htm)
Deichmann, U. (1997).
Geographical information systems in the census process – Technology options, costs and benefits. Paper prepared for the Workshop on Strategies for the 2000 Round of Population and Housing Censuses in the ESCWA Region. Cairo, 6-10 December 1997. (http://www.undp.org/popin/demotss/escwa97/giscens.htm)Gaughan, T. and P. Allen (1992). Mapping Software: a new world awaits you, Business Publishing, February 1992, pp. 21-27.
Gerland, P. (1996). Socio-economic data and GIS: datasets, databases, indicators and data integration issues, Paper presented at the UNEP/CGIAR (Consultative Group on International Agricultural Research), Arendal III Workshop on Use of GIS in Agricultural Research Management. Norway, June 17-21, 1996. 28 pages. (
http://www.un.org/Depts/unsd/softproj/papers/pg_cgiar.htm)Gutierrez, J. (1992). The Paper Chase: automatic vectorizers bring hard copy into CAD, Cadence, October 1992, pp. 85-93.
Graham, L. (1997). Modern-Day Magic: options abound for raster-to-vector conversion, GIS World, Vol. 19, No. 7, July 1997, pp. 32-38 (http://www.geoplace.com/print/gw/1997/0797/GW970700feat1.html)
Jones, C. B. (1997). Geographical information systems and computer cartography. Harlow, England: Longman, 319 pages.
Kendall, R. (1991). Mapping Software: Analysing a World of Data, PC Magazine, July 1991, pp. 249-299.
Korte, G. (1994). The GIS book: the smart manager's guide to purchasing, implementing, and running a geographic information system - 3rd ed. Santa Fe, NM: OnWord Press, c1994. 220 pages.
Kraak M.J. and F.J. Ormeling (1996). Cartography : visualisation of spatial data. Harlow, England: Longman.
Limp, W.F. (1997). Weave Maps Across the Web. GIS World, Sept. 1997. (http://www.gisworld.com/print/gw/1997/0997/GW970900feat1.html)
Marshall, P. (1995). Geographical Information Systems: a new look at old data, InfoWorld, July 31, 1995, Vol. 17, No. 31, pp. 68-79.
Melgoza, C.M. (1998). Targeting Foreign Markets Using Business Geographics. Business Geographics. July 1998. (http://www.gisworld.com/print/bg/1998/0798/798fmrkt.htm)
NIDI/UNFPA (1996). Proceedings of the Expert Group Meeting on Innovative Techniques for Population Censuses and Large Scale Demographic Surveys, Netherlands Interdisciplinary Demographic Institute (NIDI) and UNFPA, The Hague, The Netherlands, 22-26 April 1996. (
http://www.nidi.nl/innotec/index.html).Noronha, V. (1987). Choropleth Mapping in a Microcomputer Environment: A Critical Evaluation of Some Commercial Implementations, The American Cartographer, Vol. 14, No. 2, 1987. pp. 139-154.
Peuquet, D. (1981). An examination of techniques for reformatting digital cartographic data / part 1: the raster-to-vector process. Cartographica, Vol. 18, No. 1, pp. 34-48.
Pinals, D. (1998).
Choosing A Mapping Software Package That Suits Your Company's Needs. Business Geographics. July 1998. (http://www.gisworld.com/print/bg/1998/0798/798mpwre.htm)Plewe, B. (1997). GIS online : information retrieval, mapping, and the Internet.Published. Santa Fe, NM : OnWord Press, 1997. 311 pages.
Quick M. and J. Schweikart (1996). Computer Cartography in Social Research: Desktop Mapping with Microsoft Excel 7.0 in
EURODATA Newsletter, No. 3 Article 8. Spring 1996.Smith B. and H. Eglowstein (1993). Putting your Data on the Map, Byte, January 1993, pp. 188-200.
Stevenson, P. (1995). The Problem of Data Conversion, Geo Info Systems, February 1995, pp. 29-32.
Suharto, S. and Vu, D.M. (1996). Computerised cartographic work for censuses and surveys, Proceedings of the Expert Group Meeting on Innovative Techniques for Population Censuses and Large Scale Demographic Surveys, Netherlands Interdisciplinary Demographic Institute (NIDI) and UNFPA, The Hague, 22-26 April 1996. 19 pages. (
http://www.un.org/Depts/unsd/softproj/papers/sv01.htm)Tripathi, R. R. (1995). Basic concepts of Geographic Information System and its applications in population programmes. Working paper series, No. 1, UNFPA Country Support Team for Southern Africa, April 1995.
United Nations (1994). PopMap - Integrated Software Package for Geographical Information, Maps and Graphics Database. United Nations Department for Economic and Social Information and Policy Analysis, Statistics Division, New York, 345 pages.
United Nations (1996a). Population Software Notes. United Nations Statistics Division. New York, Issue 6 [Jan. 1996. 24 pages] and Issue 7 [Dec. 1996. 22 pages]. (http://www.un.org/Depts/unsd/softproj/newsletr.htm)
United Nations (1996b). MapScan - A Software Package for Automatic Map Data Entry, United Nations Statistics Division, New York. 63 pages. (http://www.un.org/Depts/unsd/softproj/software/mapscan.htm)
United Nations (1997). Geographical Information Systems for Population Statistics, Studies in Method, Series F, No. 68, Department for Economic and Social Information and Policy Analysis, Statistics Division, New York, 92 pages. (http://www.un.org/Depts/unsd/demotss/intro2.htm)
United Nations (1998a). Principles and Recommendations for Population and Housing Censuses - Revision 1. Series M, No. 67, Rev. 1, Sales No. 98.XVII.8. Department for Economic and Social Affairs, Statistics Division, New York.
United Nations (1998b). PopMap for Windows - Integrated Software Package for Geographical Information, Maps and Graphics Database (User’s Guide). United Nations Statistics Division. New York, July 1998 (3rd Revision.). 185 pages. (http://www.un.org/Depts/unsd/softproj/software/popmap.htm)
United Nations (1998c). MapScan for Windows - Software Package for Automatic Map Data Entry (User’s Guide and reference Manual - Provisional). United Nations Statistics Division. New York, July 1998. 86 pages. (http://www.un.org/Depts/unsd/softproj/software/mapscan.htm)
United Nations (1998d). Population Software Notes (Issues 8-9). United Nations Statistics Division. New York, June 1998. 40 pages. (http://www.un.org/Depts/unsd/softproj/newsletr.htm)
Vu, D.M. (1996). PopMap: geographical census software for developing countries, Proceedings of the Expert Group Meeting on Innovative Techniques for Population Censuses and Large Scale Demographic Surveys, Netherlands Interdisciplinary Demographic Institute (NIDI) and UNFPA, The Hague, 22-26 April 1996. 15 pages. (
http://www.un.org/Depts/unsd/softproj/papers/vdm961.htm)Water, N.M. and G.J.A. De Leeuw (1987). Computer Atlases to Complement Printed Atlases, Cartographica, Vol. 24, No. 1, Spring 1987. pp. 118-133.
WHO/UNICEF (1995), Joint programme on data management and mapping for public health - HealthMap, World Health Organisation, Division of Control of Tropical Diseases, Geneva, and United Nations Children's Fund, New York.
Wilson, J.D. (1997). GIS Goes Global: Technology Builds Management Resources. GIS World, Sept. 1997. (http://www.gisworld.com/print/gw/1997/1097/GW971000feat.html)
Wilson, J.D. (1998). GIS Data Collection Drives Scanner Use. GIS World, Sept. 1998. (http://www.gisworld.com/print/gw/current/998scanr.htm)
To know more about PopMap and MapScan
PopMap and MapScan have been developed by the United Nations Statistics Division with funding from the United Nations Population Fund (UNFPA) to support developing country government and academic institutions in providing appropriate tools for data processing and data analysis needs.
UNFPA-supported programmes, government agencies and academic institutions can obtain PoPMap and MapScan free of charge. Requests for software, comments and suggestions should be addressed to: Statistics Division, United Nations, Two United Nations Plaza, New York, NY, 10017, USA, fax: (212) 963-4116, e-mail: softproj_unsd@un.org
More information about the project activities, and the software can be obtained on the following Web site: http://www.un.org/Depts/unsd/softproj/index.htm